// ---- DATA: one row per dot (1 dot = 1 million workers) ----
dots = FileAttachment("data/dots.csv").csv({typed: true})Where does India work?
Evidence from PLFS (2025)
Informal employment is often pictured as a street vendor or a day labourer. The survey shows something larger. It runs through farms, workshops, offices and homes, and it is not only a feature of informal enterprises. Formal enterprises also hire informal labour. To see where it sits, let us turn every million worker into a single dot.
Where people work tells only part of the story. The next question is about the jobs themselves. Does a regular salary, or a skilled occupation, protect a worker from informality?
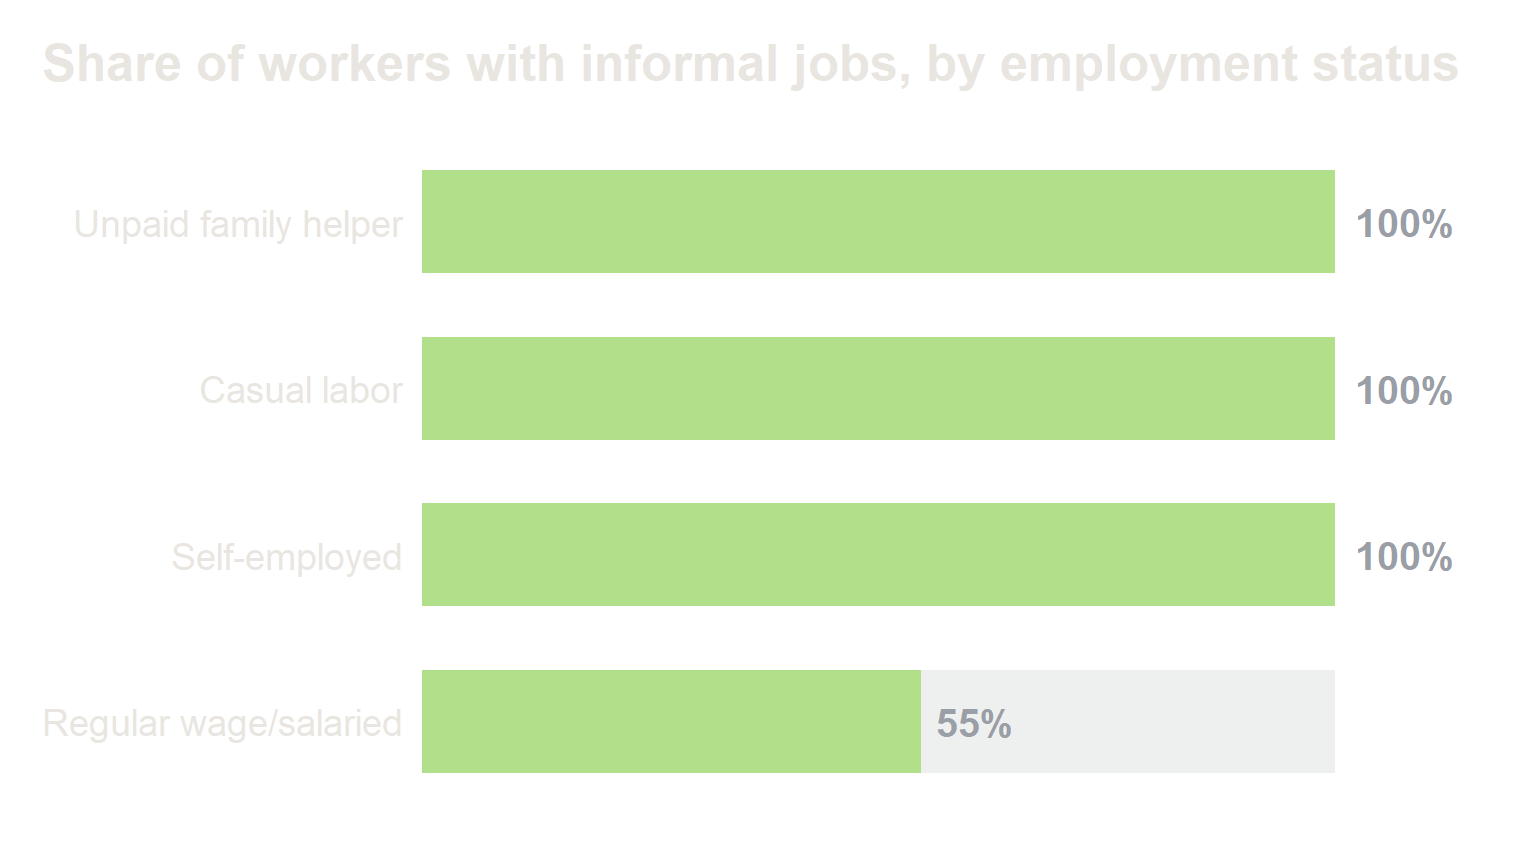
The dots showed where informal workers are. A different question is who is most likely to be informal. By definition, every casual labourer, unpaid helper and informal self-employed worker has an informal job. The open question is salaried work.
A regular salary is not protection. 55% of salaried workers, about 66 million people, are not eligible for any social security benefit, or do not know whether they are.
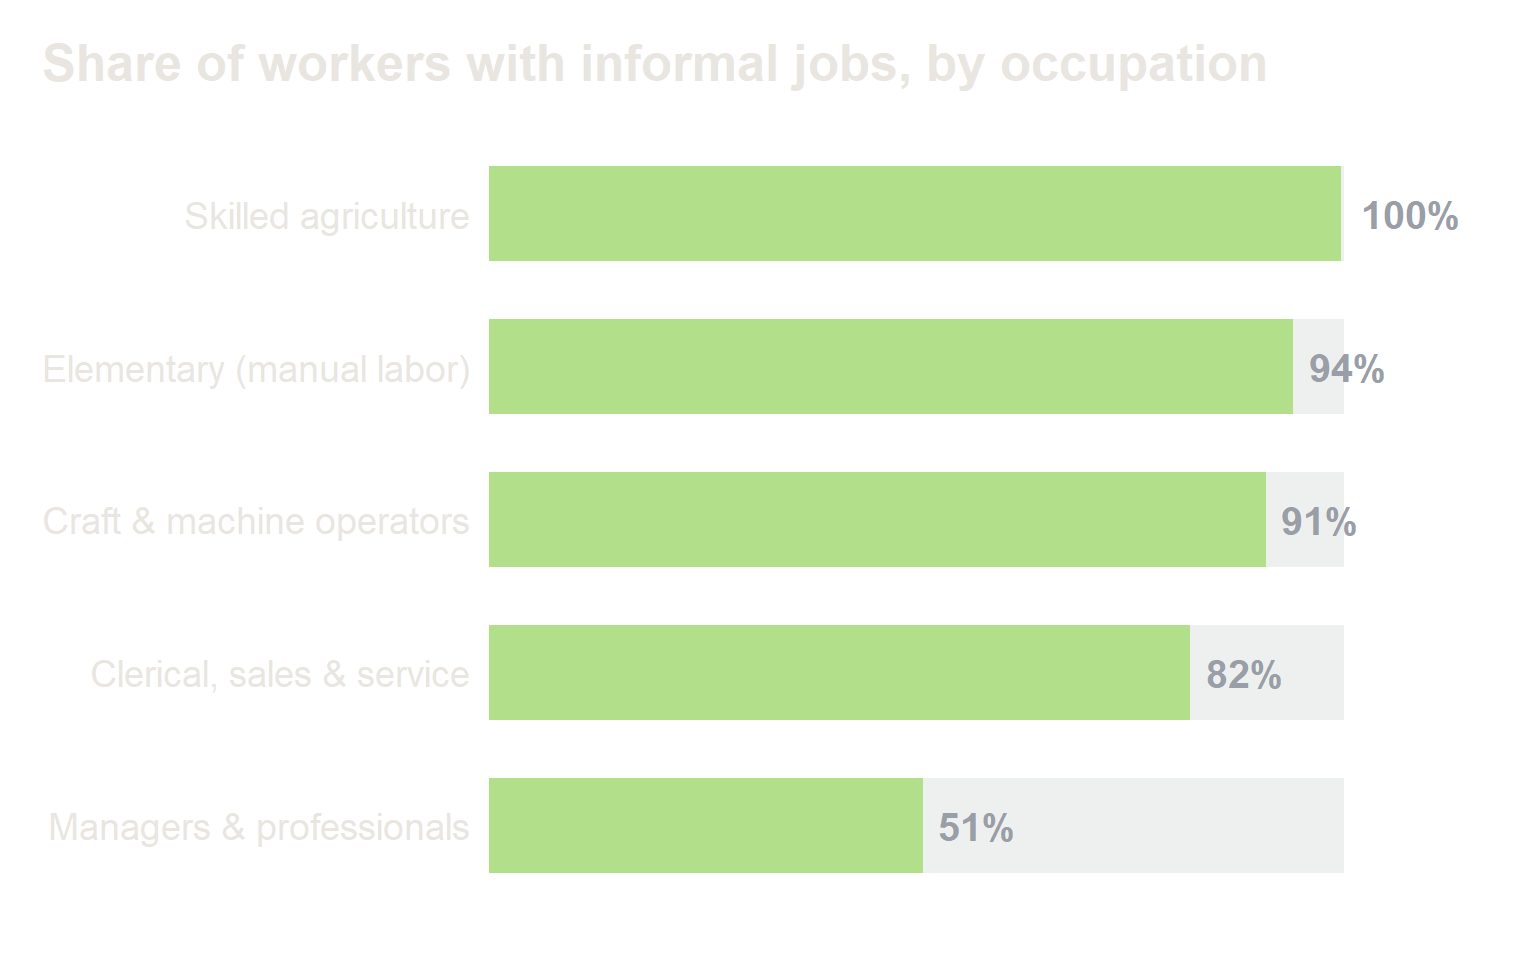
Informal employment is not confined to relatively low-skill work. Even among managers, professionals and technicians which can be considered to be relatively high-skill occupations, 51% have informal jobs.
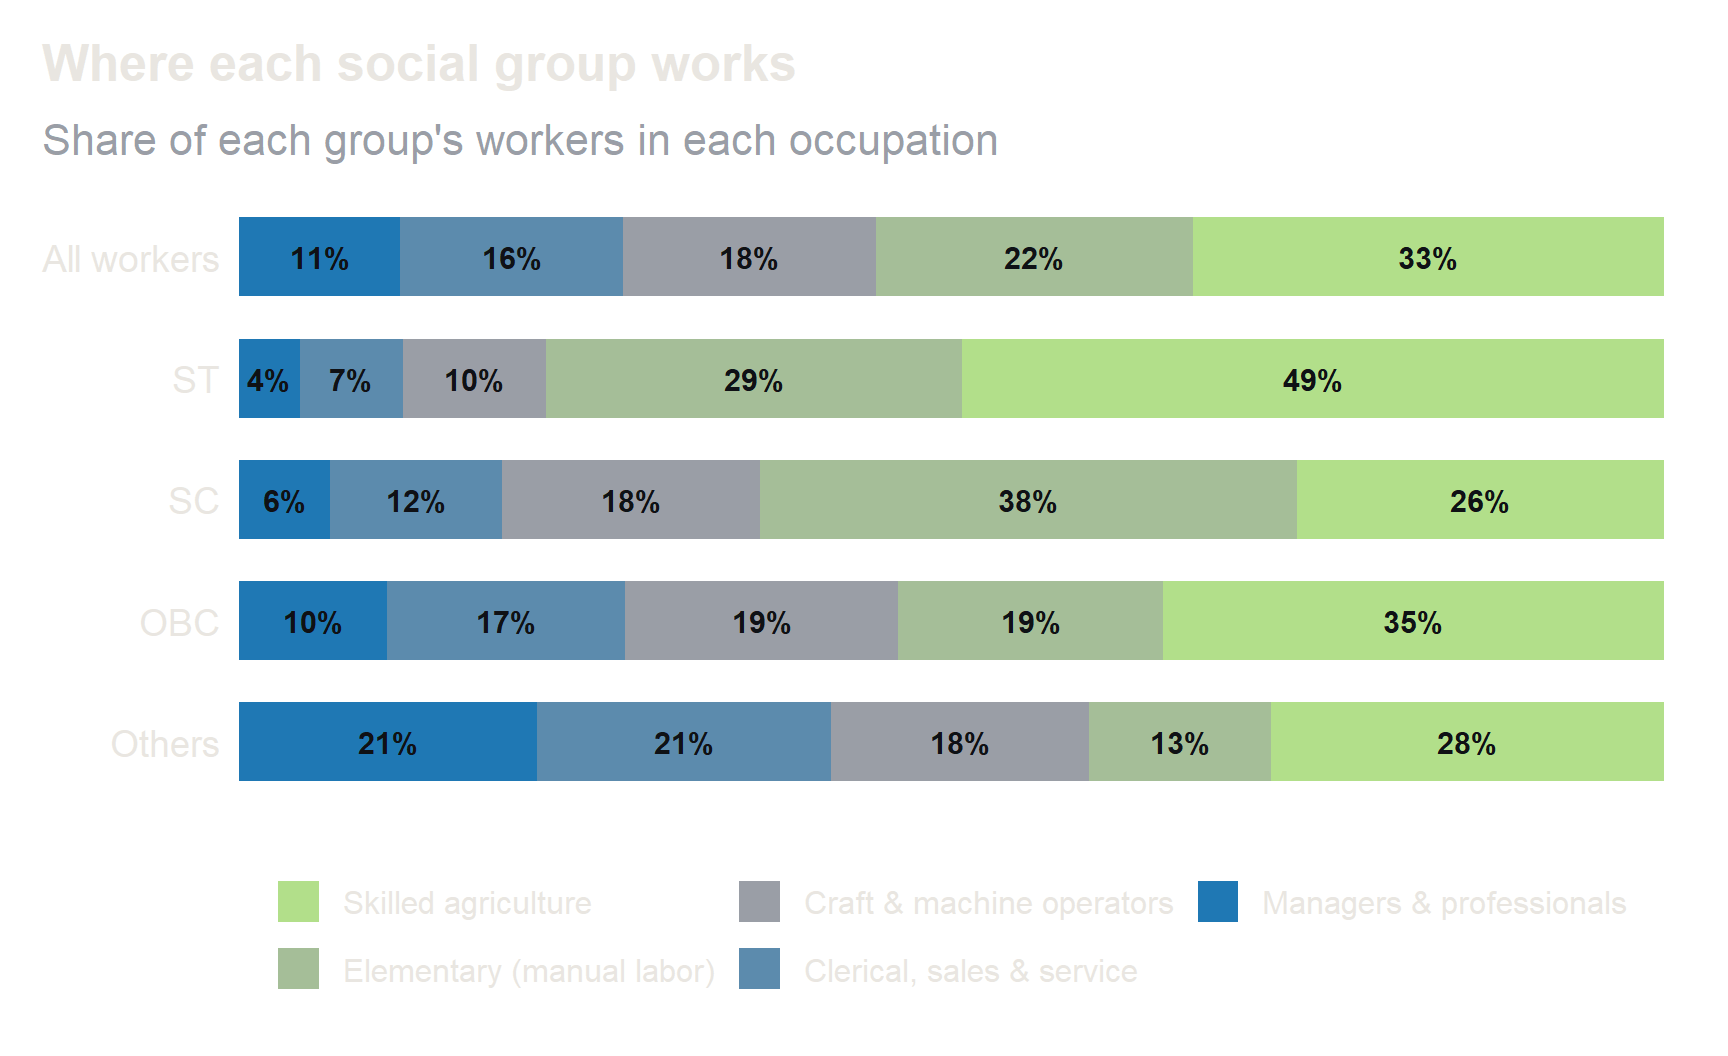
Here, we compare the share of each social group in the five broad occupation categories.
49% of ST workers are in skilled agriculture, against 28% of workers in the “Others” group. At the same time, people belonging to the “Others” social group have the highest share in occupations such as managers, professionals, clerks, sales and services. People belonging to SC groups are more likely to be engaged in elementary occupations involving manual labor (38% of workers).
We also observe that skilled agriculture accounts for majority of the employment for all social groups, except for SC. In the informal employment rate by occupation chart we saw that the share of informal employment is higher in skilled agriculture and elementary (manual labor) occupation categories compared to craft & machine operators, managers & professionals and clerical, sales & service. The color coding has been kept the same as the informal () and formal employment () used earlier. We can see that marginalized social groups have a relatively higher share of their workforce employed in occupations that have higher informal employment rates.
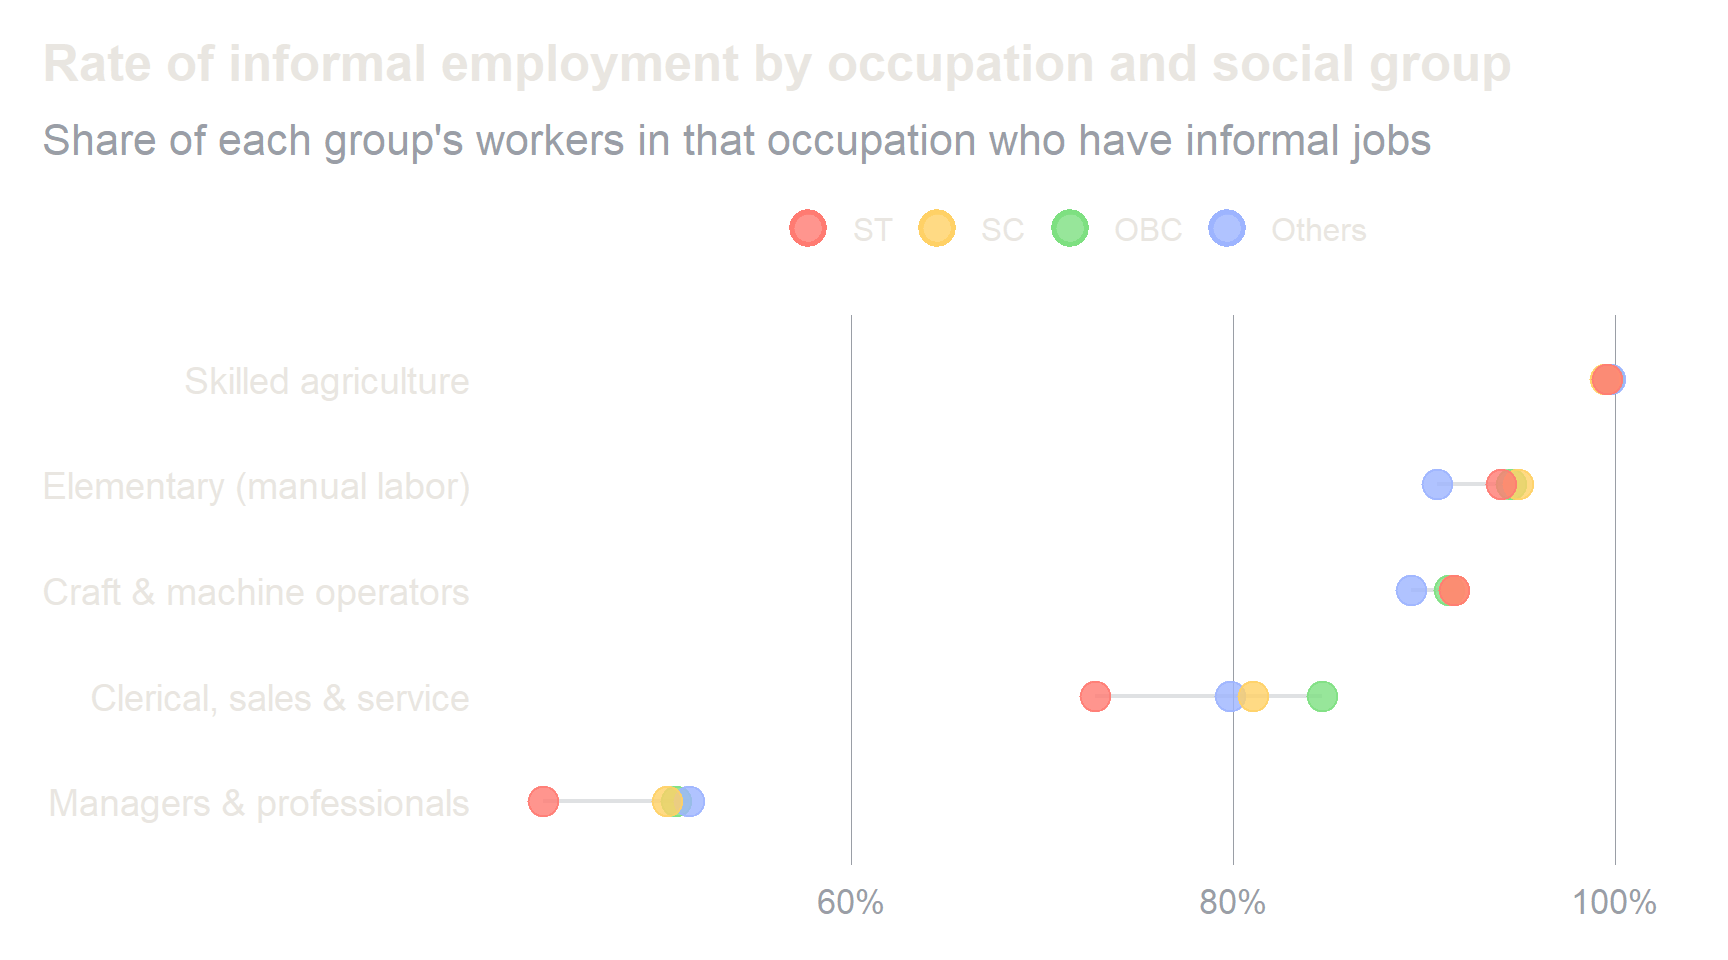
This chart depicts the exact share of people belonging to each social group who are engaged in informal employment across these occupation categories. Compare people in the same occupation: each row shows how often each group’s workers in that occupation have informal jobs. This figure complements what we found in the previous chart on sorting by occupation category.
All people engaged in skilled agriculture are in informal employment and the dots sit on top of each other.
In skilled agriculture, everyone is engaged in informal employment. All four dots sit together at the right edge. Manual and craft work look much the same. Irrespective of the social group, these jobs rarely come with a contract or social security. However, SC, ST and OBCs have a relatively higher share of informal employment in these occupation categories compared to the Others group.
The gaps get wider in the clerical, sales & service and manager and professional cateogories. Interestingly, in the managers and professionals category, the rate of informal employment is lowest among the Scheduled Tribe workers (44%), compared with 51% in the “Others” group. In clerical, sales and service work, ST workers again have the lowest rate (73%). However, informal employment in the clerical, sales & service category is highest among OBC groups, followed by SC and Others.
A likely reason is where these jobs are. Seats in government jobs are reserved for SC and ST candidates, so a larger share of the few ST workers in white-collar work are probably government teachers, clerks and officers, and government jobs nearly always come with social security. “Others” in the same occupations are spread more widely across private firms and their own businesses, where informal arrangements are common.
This is not a sign that ST workers are better off. Very few of them reach these occupations at all, and overall they remain the most informal group of all: 93% have informal jobs (see this chart).
What the dots add up to
Informality in India is not a corner of the labour market. It is the labour market. Nearly nine in ten workers, 427 million people, work without the protections that a formal job is supposed to bring: a provident fund or pension, gratuity, health and maternity cover.
The picture that emerges is broader than the usual image of street vendors and day labourers. Informal work is concentrated on farms and in small proprietary businesses, but it does not stop at their door. It reaches into government offices, companies and cooperatives, where 29% of workers hold informal jobs, and into salaried work, where more than half of all employees have no social security. A regular pay cheque, it turns out, is not the same thing as a secure job. Nor is a skilled one: about half of managers, professionals and technicians are informal too.
Informality is also unevenly shared. Scheduled Tribe and Scheduled Caste workers are more likely to be informal than others, and much of that gap comes from where they work: they are concentrated in farming and manual labour, where informality is close to universal. Within white-collar work the pattern can even reverse, most likely because reserved government posts are among the few jobs that come with full protection. Those posts matter, but they reach very few people.
These are descriptive patterns, not causes, and one survey year cannot say whether informality is rising or falling. What it does show is the scale of the gap between how most Indians work and the protections that labour law and social security are designed to provide. Any serious discussion of jobs in India has to start from that gap: not from the minority of workers on formal payrolls, but from the 89% who are not.
About the data
Source. Periodic Labour Force Survey (PLFS), calendar year 2025, Ministry of Statistics and Programme Implementation. All figures are weighted to the population.
Workers. People whose main activity over the past year was work (usual principal status). People who worked only in a subsidiary capacity are not counted, so totals are lower than official figures that include them.
Informal job (informal employment). Defined for the job, following the ILO framework. Casual labourers and unpaid family helpers are always informal. Regular wage/salaried employees are informal if they are not eligible for any social security benefit (provident fund/pension, gratuity, or health care and maternity benefits); employees who did not know are also counted as informal. Own-account workers and employers are informal if their enterprise is informal; all self-employed workers in crop farming are counted as informal. Crop farming is included in this measure.
Informal enterprise (informal sector). Defined for the employer. Following the PLFS reports, proprietary and partnership enterprises are treated as informal; government bodies, public sector units, autonomous bodies, companies, cooperatives and trusts are formal. Households employing domestic workers are a separate category. Crop farming (NIC-2008 groups 011, 012, 013 and 015: growing crops, plant propagation and mixed farming) is excluded, so informal-sector shares are shares of workers outside crop farming. Livestock, fishing and forestry are included.
Agriculture in the two measures. Crop farmers are counted in the informal-job figures but not in the informal-enterprise figures. In the industry breakdown, “Agriculture” covers crops, livestock, fishing and forestry; in the informal-enterprise breakdown it covers only livestock, fishing and forestry, and is labelled that way.
The dots. Each dot represents one million workers. Weighted counts are converted to dots by cumulative rounding, so the dot picture is approximate; the numbers in the text and labels come from the exact weighted estimates.
Caveats. Estimates for very small groups (for example, transgender workers and workers under 15) rest on few survey records and are not shown separately. Population totals implied by PLFS weights tend to be lower than official projections, so absolute numbers are conservative; shares are unaffected.
Footnotes
Workers are people whose main activity over the past year was work (usual principal status). People who worked only in a secondary, subsidiary capacity are not counted, so this total is lower than official figures that include them.↩︎